As we move from spring to summer, an interesting question arises: should those hoping for big corn yields this fall be cheering for a cooler- or warmer-than-normal summer?
 Some Like it Hot, Most Not
John Mewes | Iteris
In a previous article we looked at the impacts of cold spring weather and delayed planting on corn yields across the U.S. corn belt. As we move from spring to summer, an interesting follow-up question arises: should those hoping for big yields this fall be cheering for a cooler- or warmer-than-normal summer?
.png)
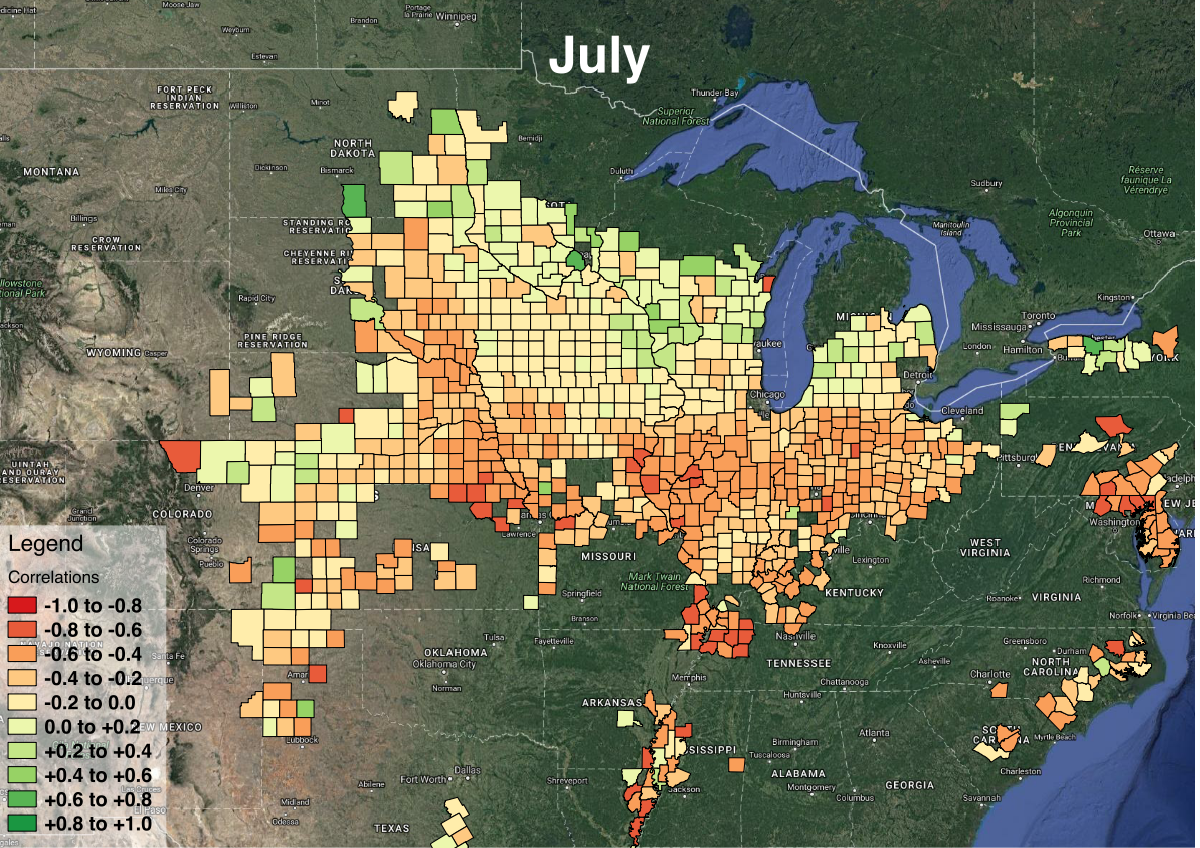
To answer this question, we can access county-level historical corn yield data from the USDA National Agricultural Statistics Service (NASS), and then look for correlations between these yields and the deviations of monthly temperatures from the climatological normals for each county. Given the steady increase in corn yields over time, we must first remove the effect of these upward trends from the county yield data before calculating correlations. The 1980-2017 temperature data required for this exercise were extracted from the ClearAg Field Weather API service.
The results of this analysis are depicted in Figure 1. The counties that are colored typically produce 90% of the U.S. corn crop. Note that the years with the highest and lowest temperatures for any given month were excluded from the correlation calculations depicted in Figure 1, as were the years with the highest and lowest detrended yield for each county. These exclusions were intended to limit the impacts of years that are potentially significant outliers on the calculated correlation coefficients.
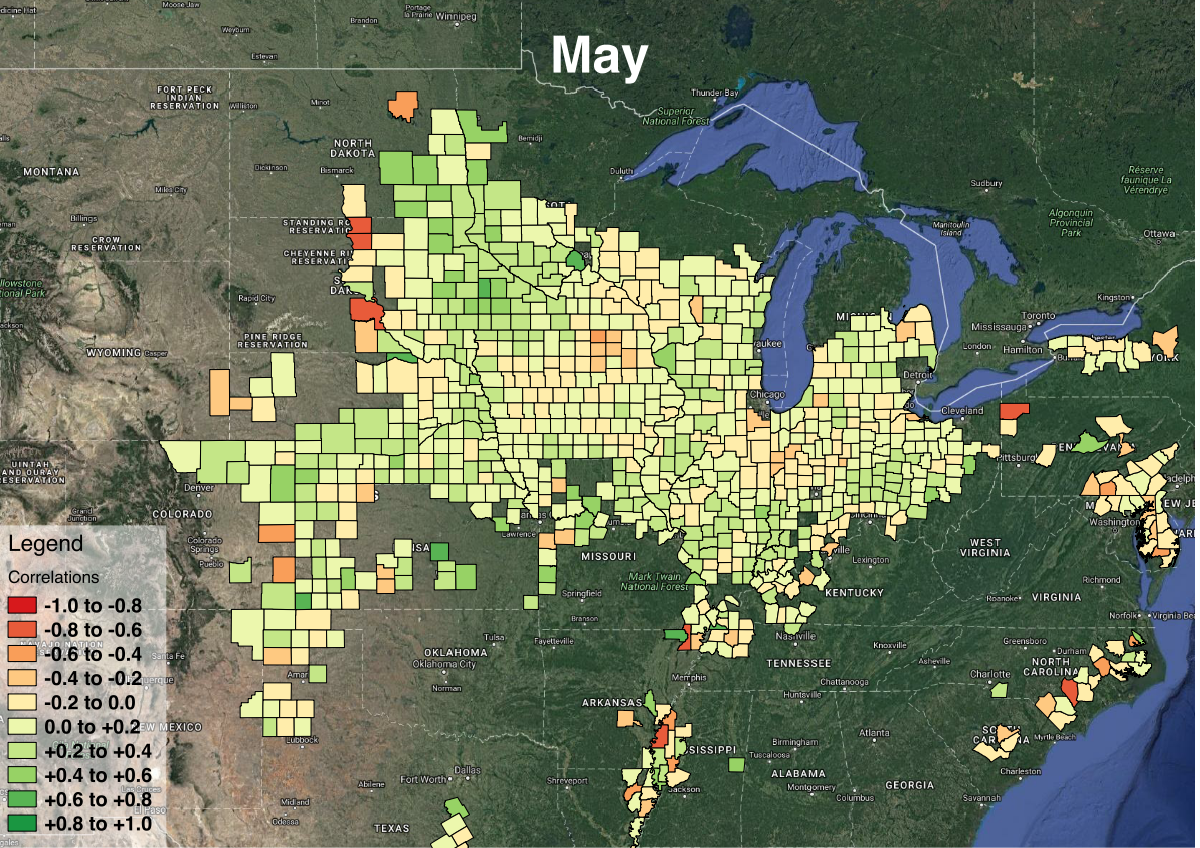


Figure 1: The county-by-county correlations between the final corn yield and the monthly temperature deviations, for the months of May, June, July and August, for the major corn-producing counties of the United States. The correlation coefficients indicated were calculated across the years 1980-2017. Positive correlation coefficients (green shades) indicate counties where warmer-than-average weather is typically associated with higher corn yields, and vice-versa.
In Figure 1, positive correlation coefficients (green shades) indicate counties where warmer-than-average weather is typically associated with above-trendline corn yields, while negative correlations (red shades) indicate counties where warmer-than-average weather is typically associated with below-trendline corn yields. We can see from Figure 1 that warmer-than-average temperatures in May are associated with better corn yields nearly everywhere (evidenced by the relative abundance of green shades relative to red shades). As the calendar turns to June and then July, however, warmer-than-average temperatures become detrimental to corn yields in all but a corridor from Wisconsin northwestward through North Dakota, and a handful of counties in and around the high plains of Colorado. Hot August weather is detrimental to corn yields nearly everywhere, with the most pronounced correlations with reduced yields lying in the vicinity of southeastern Nebraska and southwestern Iowa.
Here’s to hoping you get a summer that helps pad your pocketbook!


The content & opinions in this article are the author’s and do not necessarily represent the views of AgriTechTomorrow
Comments (0)
This post does not have any comments. Be the first to leave a comment below.
Featured Product